
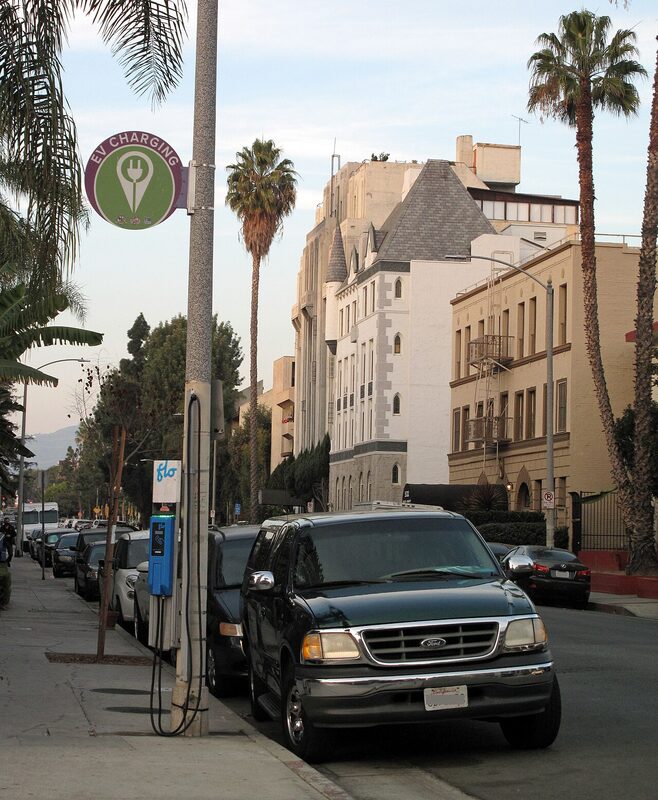
The US Department of Energy's Alternative Fuels Data Center (AFDC) updated its station-count table on Oct. 21, 2026. It lists 83,352 electric charging locations with 262,196 ports. Of those ports, 693 are Level 1, 182,484 are Level 2 and 79,007 are DC fast.
The table's footnote says the counts include legacy chargers and exclude residential ones, and that for electric stations the total counts ports, not locations.
Below are answers to the questions these numbers raise, using the AFDC table and the most recent independent count of fast chargers.
How much of the network is fast charging?
About 30% of the counted ports are DC fast (79,007 of 262,196), and roughly 70% are Level 2 (182,484). Level 1 is a rounding error at 693 ports. Level 2 ports still outnumber DC fast ports by more than two to one.
On average there are about 3.1 ports per location nationwide (262,196 ports across 83,352 locations). Most sites have a few plugs, not a large row of them.
Is California really a quarter of the network?
Yes, by locations and DC fast ports, and slightly more by total ports. The AFDC table lists 20,360 locations and 69,556 ports in California, including 19,602 DC fast ports. That works out to:
- about 26.5% of all US charging ports,
- about 24.4% of all locations,
- about 24.8% of all DC fast ports.
California's 19,602 DC fast ports nearly match the combined total of the next six states in the table (New York, Florida, Texas, Massachusetts, Washington and Colorado), which is 20,505.
Who comes after California?
Here is how the next six states compare, in locations, total ports and DC fast ports, according to the AFDC table:
- New York: 5,505 locations / 20,352 ports / 3,307 DC fast
- Florida: 4,432 / 15,417 / 5,422
- Texas: 3,837 / 13,102 / 5,681
- Massachusetts: 4,594 / 11,816 / 1,967
- Washington: 3,219 / 9,169 / 2,418
- Colorado: 2,934 / 7,975 / 1,710
Together, these seven states hold 147,387 ports, about 56% of the national total, and 40,107 DC fast ports, about 51% of the national fast-charging count.
Why does Texas rank differently depending on the measure?
The mix of charger types varies a lot from state to state. Texas ranks fourth in total ports but has 5,681 DC fast ports, more than Florida's 5,422, even though Florida has about 2,300 more ports overall. In Texas, roughly 43% of ports are DC fast. Florida is at about 35% and California about 28%.
New York and Massachusetts are the opposite case. New York has the second-most ports in the country, but only about 16% are DC fast (3,307 of 20,352). Massachusetts is close to that at about 17%. Both states' networks lean heavily on Level 2.
Locations and ports also tell different stories. Massachusetts lists more charging locations (4,594) than Florida (4,432) but has fewer ports, about 2.6 per site compared with Florida's 3.5. New York averages about 3.7 ports per location, the highest of the seven states listed.
Why doesn't the AFDC fast-charging number match Paren's?
Paren, a charging-data firm that says it monitors more than 98% of US fast-charging ports, published its third-quarter 2026 report on Oct. 13, according to mGrid. The report counts 80,964 fast-charging ports at 14,614 locations nationwide. The AFDC's 79,007 DC fast ports, as of Oct. 21, is about 1,950 lower.
The two counts are built differently. The AFDC is a federal station database with its own inclusion rules: it counts legacy chargers, excludes residential units Paren's figure comes from its own monitoring of fast-charging ports. The gap is small enough to come from differences in definitions and reporting timing, and neither source explains it. Both counts put US fast-charging ports above 79,000 in October 2026.
Is the fast-charging network still growing?
Yes, but more slowly than last year, according to Paren. The Q3 report, as described by Yahoo Autos and EV Infrastructure News, says operators added 664 stations and 4,106 fast-charging ports from July through September. That pushed the national fast-port count past 80,000 for the first time.
Paren counted 2,158 fast-charging stations opened in the first nine months of 2026, about 20% fewer than in the same period of 2025, according to Yahoo Autos. EV Infrastructure News reports that Paren expects openings to peak in the fourth quarter, as they did in 2025.
New sites are also larger and more powerful. Paren found that 73% of new ports added in the quarter are rated at 250 kW or higher, per Yahoo Autos.
Who runs the fast chargers?
Tesla still runs about half of them, but its share is shrinking. Paren puts Tesla at 49.3% of the installed fast-charging base, down from 54.3% a year earlier, according to Yahoo Autos.
On pricing, mGrid's Oct. 16, 2026 summary of the Paren report says Tesla's non-member Supercharger price averaged $0.569/kWh, up 15%, and puts the national average peak time-of-use price at $0.637/kWh. These figures are Paren's Q3 2026 measurements. Actual prices vary by site and time of day.
Are the chargers being used?
Usage is steady. Paren measured national fast-charger utilization at 15.9% in Q3, compared with 15.8% in Q2, according to mGrid, over 50.4 million sessions (per Yahoo Autos). Usage is concentrated in big cities. The top 30 metro areas averaged 21.1% utilization, compared with 11.0% everywhere else, and Los Angeles reached 31.8%, mGrid reports.
California holds the largest share of ports in the AFDC table, and Los Angeles posted the highest utilization of any metro in Paren's data.
What It Means for Drivers
Coverage is real but uneven. As of Oct. 21, 2026, the AFDC lists 262,196 electric charging ports at 83,352 locations. More than half of those ports are in the seven states above. A driver in California, New York or Florida will find far more options than the national average suggests, while drivers in other states will find fewer.
Check the type of charger, not only the number of sites. About 70% of counted ports are Level 2, which fits stops of a few hours, such as at work, a hotel or a shopping center. For road trips, the DC fast count (79,007 per AFDC, 80,964 per Paren) matters more. That share differs sharply by state: about 43% of ports in Texas are DC fast, compared with about 16% in New York.
Listings are not a guarantee. The AFDC total includes legacy chargers, so a listed site may use older hardware. Confirm access, connector type and working status before you rely on a stop.
More openings are expected this quarter, mostly high-power sites. Paren expects a Q4 peak in openings, and 73% of the ports added in Q3 were rated at 250 kW or higher. A kW rating is a ceiling; what a car actually draws depends on the vehicle, per Yahoo Autos.
Prices rose at the largest network. Paren's Q3 data, as reported by mGrid on Oct. 16, 2026, puts Tesla's non-member rate at $0.569/kWh, up 15%. Before you plug in, check the posted price for the specific site and time of day.
Sources
- Alternative Fueling Station Counts by State (DOE Alternative Fuels Data Center, data last updated 10/21/2026)
- Bigger Hubs, Higher Tesla Prices: Decoding America's Q3 Fast-Charging Data (Yahoo Autos)
- US Fast Chargers Pass 80,964 Ports, But Utilization Stays Flat at 15.9% as Tesla Raises Prices (mGrid, Oct. 16, 2026)
- US fast charging network surpasses 80,000 ports in Q3 2026 (EV Infrastructure News)
